How to read this data:
The following data comes from the last U.S. Census and should be understood as if to say, "in Chicago, 84.6% of the Black population would have to move in order for the city to have an equally-sized White population..."
Black/White
1. Chicago, 84.6 %
2. New York, 82.2
3. Atlanta, 81.5
4. Washington, 79.7
5. Cleveland, 77.3
6. Newark, 76.7
7. Philadelphia, 76.4
8. Baltimore, 71.1
9. Houston, 70.9
10. Los Angeles, 70.6
Latino/White
1. Oakland, 69.9%
2. New York, 67.1
3. Los Angeles, 65.6
4. Philadelphia, 64.3
5. Long Beach, 61.1
6. Milwaukee, 60.9
7. Dallas, 60.6
8. San Diego, 60.1
9. Washington, 59.4
10. Chicago, 59.2
Asian/White
1. New Orleans, 57.9%
2. Newark, 55.4
3. Long Beach, 51.7
4. Detroit, 51.0
5. St. Paul, 50.6
6. Oakland, 50.3
7. Pittsburgh, 50.1
8. New York, 49.2
9. Philadelphia, 48.6
10. Atlanta, 48.1
Other cities where large percentages of the population (x) would have to be uprooted to be the size of that city's white population:
San Francisco:
where x =
Black: 56.1%,
Hispanic: 53.1%,
Asian: 40.2%.
Seattle:
Black: 57.3%,
Hispanic: 34.5%,
Asian: 45.3%.
Boston:
Black: 69.8%,
Hispanic: 53.3%,
Asian: 39.6%.
St. Louis:
Black: 68.4%,
Hispanic: 30.3%,
Asian: 40.7%.
Phoenix:
Black: 49.2%,
Hispanic: 57.7%,
Asian: 23.8%.
Source: U.S. Census
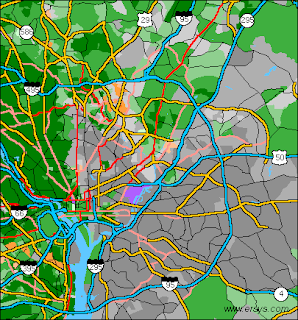
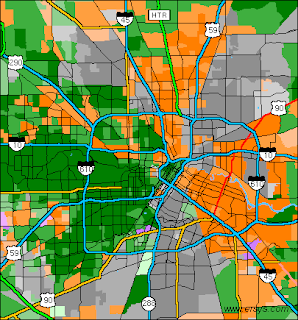
More segregation data:
Courtesy of Ersys:

Chicago, IL

New York, NY

Atlanta, GA

Washington, D.C.
Cleveland, OH

Newark, N.J.

Philadelphia, PA

Baltimore, MD

Houston, TX
Los Angeles, CA

Seattle, WA

Miami, FL

The following data comes from the last U.S. Census and should be understood as if to say, "in Chicago, 84.6% of the Black population would have to move in order for the city to have an equally-sized White population..."
Black/White
1. Chicago, 84.6 %
2. New York, 82.2
3. Atlanta, 81.5
4. Washington, 79.7
5. Cleveland, 77.3
6. Newark, 76.7
7. Philadelphia, 76.4
8. Baltimore, 71.1
9. Houston, 70.9
10. Los Angeles, 70.6
Latino/White
1. Oakland, 69.9%
2. New York, 67.1
3. Los Angeles, 65.6
4. Philadelphia, 64.3
5. Long Beach, 61.1
6. Milwaukee, 60.9
7. Dallas, 60.6
8. San Diego, 60.1
9. Washington, 59.4
10. Chicago, 59.2
Asian/White
1. New Orleans, 57.9%
2. Newark, 55.4
3. Long Beach, 51.7
4. Detroit, 51.0
5. St. Paul, 50.6
6. Oakland, 50.3
7. Pittsburgh, 50.1
8. New York, 49.2
9. Philadelphia, 48.6
10. Atlanta, 48.1
Other cities where large percentages of the population (x) would have to be uprooted to be the size of that city's white population:
San Francisco:
where x =
Black: 56.1%,
Hispanic: 53.1%,
Asian: 40.2%.
Seattle:
Black: 57.3%,
Hispanic: 34.5%,
Asian: 45.3%.
Boston:
Black: 69.8%,
Hispanic: 53.3%,
Asian: 39.6%.
St. Louis:
Black: 68.4%,
Hispanic: 30.3%,
Asian: 40.7%.
Phoenix:
Black: 49.2%,
Hispanic: 57.7%,
Asian: 23.8%.
Source: U.S. Census
More segregation data:
Courtesy of Ersys:

Chicago, IL

New York, NY

Atlanta, GA

Washington, D.C.

Cleveland, OH

Newark, N.J.

Philadelphia, PA

Baltimore, MD

Houston, TX

Los Angeles, CA

Seattle, WA

Miami, FL

